Note
Go to the end to download the full example code.
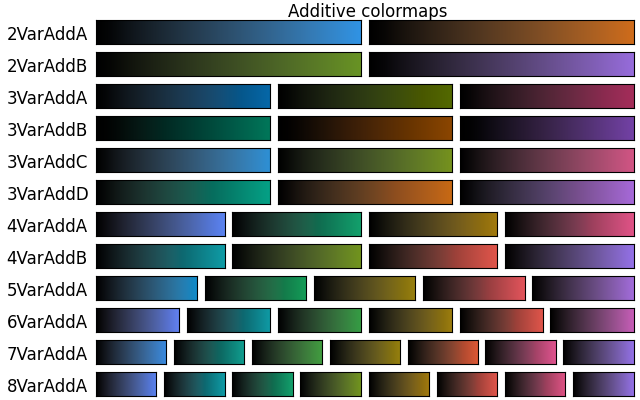
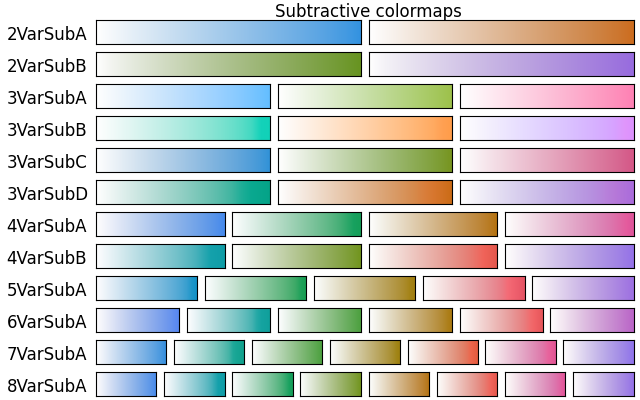
Multivariate colormap reference#
Reference for bivariate colormaps included with Matplotlib.
import matplotlib.pyplot as plt
import numpy as np

import matplotlib.colors


def plot_multivariate_cmaps(key):
    cmap_names = [name for name in matplotlib.multivar_colormaps.keys()
                  if key[:3] in name]

    fig = plt.figure(figsize=(6.4, (len(cmap_names)+0.5)*0.32))
    vstep = 1/(len(cmap_names)+0.5)
    fig.text((1+0.15)/2, 1-0.1*vstep, key+' colormaps',
             va='top', ha='center', fontsize=12)

    for i, cmap_name in enumerate(cmap_names):
        multivar_cmap = matplotlib.multivar_colormaps[cmap_name]
        hstep = (0.84 + 0.012) / len(multivar_cmap)
        vpos = 1.01 - (i + 1.5) * vstep
        for j, component in enumerate(multivar_cmap):
            ax = fig.add_axes((0.15 + j * hstep, vpos,
                               hstep - 0.012, vstep - 0.02))
            ax.imshow(component(np.linspace(0, 1, 256)) * np.ones((20, 256, 4)),
                      aspect='auto')
        fig.text(0.01, vpos, cmap_name, va='bottom', ha='left', fontsize=12)

    for ax in fig.axes:
        ax.set_yticks([])
        ax.set_xticks([])
    fig.show()

for key in ('Additive', 'Subtractive'):
    plot_multivariate_cmaps(key)
See also: Bivariate colormap reference, Colormap reference
References
The use of the following functions, methods, classes and modules is shown in this example:
Total running time of the script: (0 minutes 1.495 seconds)